Pin Bar is a very important candlestick signal that you should master how to trade. There are naked traders who just love to trade with the pin bar. If you are not familiar how to trade naked then you should watch this webinar recording that explains how to master naked trading using only price action. Now as said above pin bar is a very important candlestick pattern that you should master. Pin bar is a signal that the market is finding support or resistance at that price level. Pin bars are also known as hanging man, hammer, inverted hammer etc. Just remember the name pin bar. If the candle is bullish call it a bullish pin bar and if the bar is bearish call it a bearish pin bar. Bullish pin bar is a signal that bulls won over the bears and price found support at the low of the pin bar. In the same manner, a bearish pin bar is a signal that bears won over the bulls and price found resistance at the high of the bar. Watch the videos below that explain it detail what this pattern means when it appears on the charts and how you are going to trade it.
Nial Fuller is a master of naked trading. Watch the video below in which he explains the how to trade reversals using pin bars.
This is another good video on pin bars by Nial Fuller!
Now if you need a pin bar indicator you should copy the following code into your Meta Editor, click compile and then install it on your chart.
//+——————————————————————+
//| Pin.mq4 |
//| Copyright 2015, mrak297. |
//| https://www.mql5.com/ru/users/mrak297 |
//+——————————————————————+
#property copyright “Copyright 2015, mrak297.”
#property link “https://www.mql5.com/ru/users/mrak297”
#property version “15.08”
#property strict
#property indicator_chart_window
//— input parameters
input int Depth = 40; //Depth of pinbars in percents
input int MaxRange = 100; //Maximum range
input int MinRange = 20; //Minimum range
input bool Extremum = true; //Only extremum
double Pp;
//+——————————————————————+
//| Custom indicator initialization function |
//+——————————————————————+
int OnInit()
{
if (Point() == 0.0001 || Point() == 0.00001) Pp = 0.0001;
if (Point() == 0.01 || Point() == 0.001) Pp = 0.01;
return(INIT_SUCCEEDED);
}
//+——————————————————————+
//| Custom indicator iteration function |
//+——————————————————————+
int OnCalculate(const int rates_total,
const int prev_calculated,
const datetime &time[],
const double &open[],
const double &high[],
const double &low[],
const double &close[],
const long &tick_volume[],
const long &volume[],
const int &spread[])
{
//—
string name = ” “;
for (int i = 1; i < Bars-1; i++)
{
if (PinUp(time[i], open[i], high[i], low[i], close[i], Depth))
{
name = “PinUp”+TimeToString(time[i], TIME_DATE|TIME_MINUTES);
ArrowSellCreate(name, time[i], high[i]);
}
if (PinDown(time[i], open[i], high[i], low[i], close[i], Depth))
{
name = “PinDown”+TimeToString(time[i], TIME_DATE|TIME_MINUTES);
ArrowBuyCreate(name, time[i], low[i]);
}
}
//— return value of prev_calculated for next call
return(rates_total);
}
//+——————————————————————+
//| |
//+——————————————————————+
void OnDeinit(const int reason)
{
ObjectsDeleteAll(0, -1, OBJ_ARROW);
}
//+——————————————————————+
//| |
//+——————————————————————+
bool PinUp(datetime time, double open, double high, double low, double close, int depth)
{
int range = (int)MathRound((high – low)/Pp);
int zone = (int)MathRound(range * depth * 0.01);
int shift = iBarShift(_Symbol, PERIOD_D1, time, true);
double dayHidh = iHigh(_Symbol, PERIOD_D1, shift);
double level = NormalizeDouble(low + zone * Pp, _Digits);
bool check = false;
if (range > MinRange && range < MaxRange)
{
if ((Extremum && high == dayHidh) || !Extremum)
check = true;
if (open <= level && close <= level && check)
{
return(true);
}
}
return(false);
}
//+——————————————————————+
//| |
//+——————————————————————+
bool PinDown(datetime time, double open, double high, double low, double close, int depth)
{
int range = (int)MathRound((high – low)/Pp);
int zone = (int)MathRound(range * depth * 0.01);
int shift = iBarShift(_Symbol, PERIOD_D1, time, true);
double dayLow = iLow(_Symbol, PERIOD_D1, shift);
double level = NormalizeDouble(high – zone * Pp, _Digits);
bool check = false;
if (range > MinRange && range < MaxRange)
{
if ((Extremum && low == dayLow) || !Extremum)
check = true;
if (open >= level && close >= level && check)
{
return(true);
}
}
return(false);
}
//+——————————————————————+
//| |
//+——————————————————————+
void ArrowSellCreate(string name, datetime time, double price)
{
ResetLastError();
if(ObjectCreate(0,name,OBJ_ARROW_SELL,0,time,price))
{
ObjectSetInteger(0,name,OBJPROP_COLOR,clrTomato);
ObjectSetInteger(0,name,OBJPROP_STYLE,STYLE_SOLID);
ObjectSetInteger(0,name,OBJPROP_WIDTH,1);
ObjectSetInteger(0,name,OBJPROP_BACK,true);
ObjectSetInteger(0,name,OBJPROP_SELECTABLE,false);
ObjectSetInteger(0,name,OBJPROP_HIDDEN,true);
ObjectSetInteger(0,name,OBJPROP_ZORDER,0);
}
}
//+——————————————————————+
//| |
//+——————————————————————+
void ArrowBuyCreate(string name, datetime time, double price)
{
ResetLastError();
if(ObjectCreate(0,name,OBJ_ARROW_BUY,0,time,price))
{
ObjectSetInteger(0,name,OBJPROP_COLOR,clrDodgerBlue);
ObjectSetInteger(0,name,OBJPROP_STYLE,STYLE_SOLID);
ObjectSetInteger(0,name,OBJPROP_WIDTH,1);
ObjectSetInteger(0,name,OBJPROP_BACK,true);
ObjectSetInteger(0,name,OBJPROP_SELECTABLE,false);
ObjectSetInteger(0,name,OBJPROP_HIDDEN,true);
ObjectSetInteger(0,name,OBJPROP_ZORDER,0);
}
}
//+—————————————————————–+
Now you can install this pin bar indicator on your chart. Take a look at the following GBPUSD M30 chart.
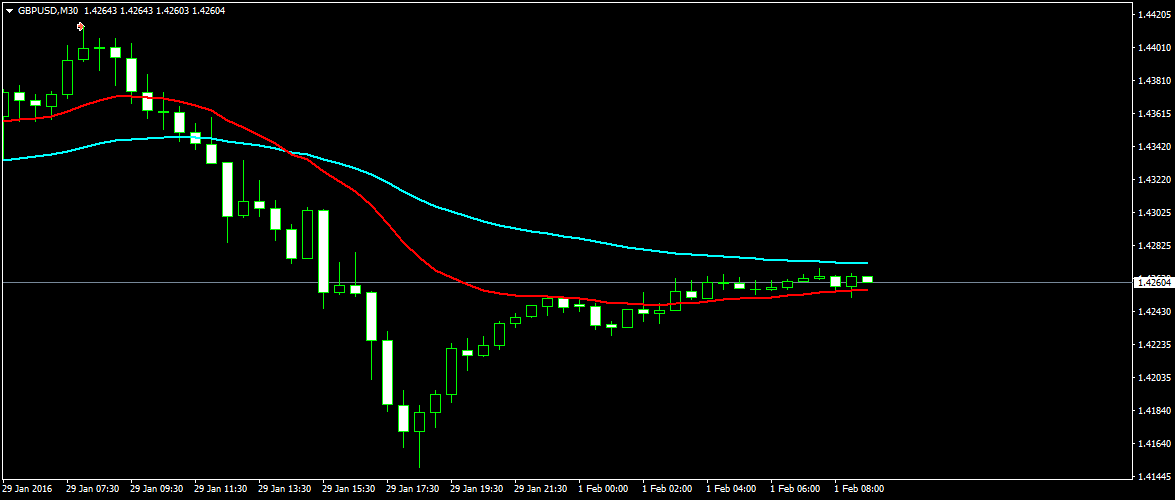
You can see in the above screenshot, a small arrow that is a signal given by this pin bar indicator. Your risk is only 15 pips. The price falls around 250 pips after that. So you can see how powerful pin bar signals can be.