I have been trading on MT4 for a long time.
I use MACD as a momentum indicator. It gives me the trend momentum. MACD is pretty useless in giving a good entry. You will have to do the entry using candlestick patterns, intuition and experience. Once a trend starts, MACD can give you the trend momentum. If the momentum is strong, you will have the MACD show it and when the momentum changes it will also show it.
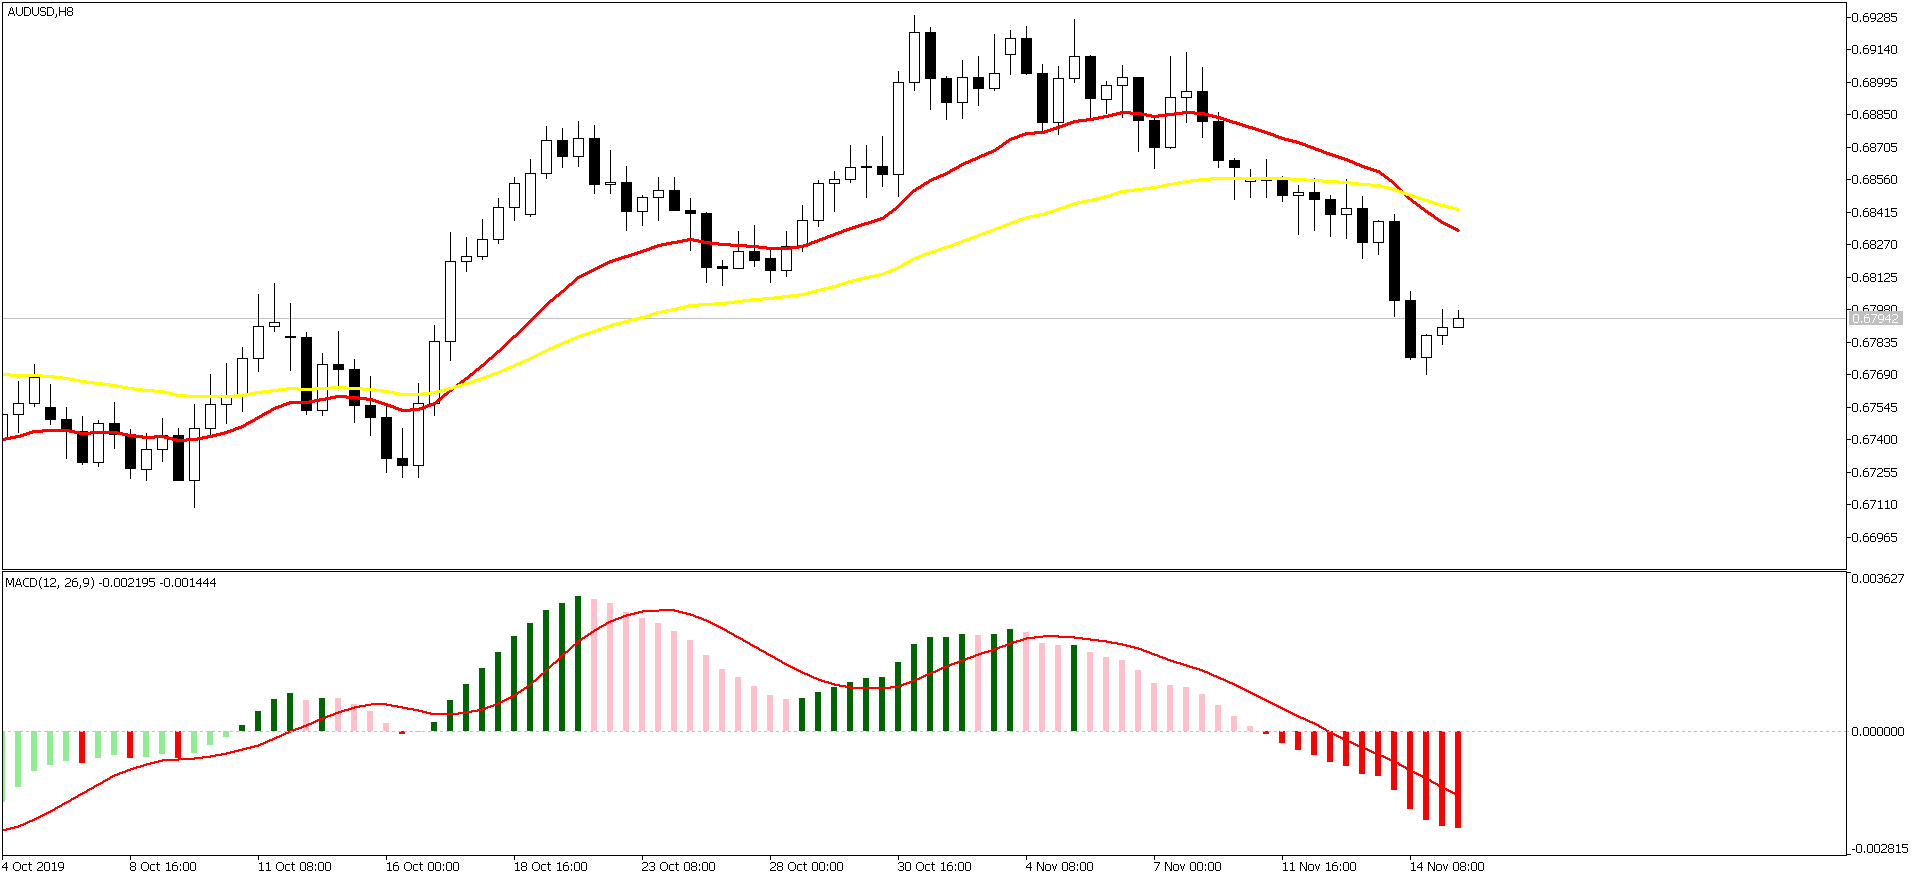
As you can see in the above AUDUSD H8 chart, MACD is color red. This is an indication that the momentum is down and we don’t need to get confused if we have a bullish candle appear. As long as MACD is showing red color, the momentum is down and we should continue with the short trade. AUDUSD fell more than 150 pips. The way that I have coded this MACD, when you see light green and dark green, it means the trend is up and you should avoid, opening a short trade. Similarly when the MACD is showing pink and red colors, the trend momentum is down and you should avoid opening a long trade. On a lower timeframe like H4, MACD color can change. But if you follow H8, continue in the trade as long as the color doesn’t change. A color changing on the lower timeframe is just a signal for a retracement. Take a look at your stops, if they are too tight and you think price can retrace back to your stop loss level, then close the trade to be on the safe side.There is a great fear of
In this post we will code MACD indicator that will be a standard indicator but its bars will change color when the momentum increases or decreases thus making it visually more appealing.
//+------------------------------------------------------------------+
//|                                                   MACD_Color.mq5 |
//|                                                     Ahmad Hassam |
//|                                      https://www.doubledoji.com/ |
//+------------------------------------------------------------------+
#property copyright "Ahmad Hassam"
#property link      "https://www.doubledoji.com/"
#property description "Moving Average Convergence/Divergence"
#property version   "1.00"
#property indicator_separate_window
#property indicator_buffers 4
#property indicator_plots   2


//--- plot MACD HISTOGRAM
#property indicator_label1  "MACD"
#property indicator_type1   DRAW_COLOR_HISTOGRAM
#property indicator_color1  clrLightGreen, clrDarkGreen, clrPink, clrRed
#property indicator_style1  STYLE_SOLID
#property indicator_width1  3


//--- plot MACD Signal
#property indicator_label2  "Signal"
#property indicator_type2   DRAW_LINE
#property indicator_color2  clrRed
#property indicator_style2  STYLE_SOLID
#property indicator_width2  2

//--- input parameters
input int      fastEMA=12;
input int      slowEMA=26;
input int      signalPeriod=9;
input ENUM_APPLIED_PRICE MAPrice = PRICE_CLOSE;

//--- indicator buffers
double         macd_main[];   //MACD Histogram
double         macd_color[];  //MACD Histogram bar colors
double         macd_signal[]; //MACD Signal
double         macd_signal_color[];

//--declare MACD Handle
int macdHandle;
//+------------------------------------------------------------------+
//| Custom indicator initialization function                         |
//+------------------------------------------------------------------+
int OnInit()
  {
//--- name for Dindicator subwindow label
IndicatorSetString(INDICATOR_SHORTNAME,
"MACD("+string(fastEMA)+", "+string(slowEMA)+","+string(signalPeriod)+")");

//--- indicator buffers mapping
//--- Bind the color buffer immediately below the data buffer
   SetIndexBuffer(0,macd_main,INDICATOR_DATA);
   SetIndexBuffer(1,macd_color,INDICATOR_COLOR_INDEX);
   SetIndexBuffer(2,macd_signal,INDICATOR_DATA);
   SetIndexBuffer(3,macd_signal_color,INDICATOR_COLOR_INDEX);

//--Initialize the MACD
   macdHandle = iMACD(_Symbol,_Period,fastEMA,
   slowEMA,signalPeriod, MAPrice);
//---

   return(INIT_SUCCEEDED);
  }


//+------------------------------------------------------------------+
//| Custom indicator iteration function                              |
//+------------------------------------------------------------------+
int OnCalculate(const int rates_total,
                const int prev_calculated,
                const int begin,
                const double &price[])
  {


//--- set buffers as series, most recent entry at index [0]
   ArraySetAsSeries(macd_main,true);
   ArraySetAsSeries(macd_color,true);
   ArraySetAsSeries(macd_signal,true);
   ArraySetAsSeries(macd_signal_color,true);


 int bars = rates_total - 1;
   if(prev_calculated > 0)
     {
      bars = rates_total - prev_calculated;
     }


//--Copy MACD histogram and the signal to indicator data buffers
   CopyBuffer(macdHandle,0,0,bars,macd_main);
   CopyBuffer(macdHandle,1,0,bars,macd_signal);


   for(int i = bars-slowEMA-1; i >= 0; i--)

   {

//--color code the MACD bars
   if( macd_main[i] > macd_main[i+1] && macd_main[i] < 0)macd_color[i]=0;
   if( macd_main[i] > macd_main[i+1] && macd_main[i] > 0)macd_color[i]=1;
   if( macd_main[i] < macd_main[i+1] && macd_main[i] > 0)macd_color[i]=2;
   if( macd_main[i] < macd_main[i+1] && macd_main[i] < 0)macd_color[i]=3;

  }

//--- return value of prev_calculated for next call
   return(rates_total);
  }


//+------------------------------------------------------------------+
Now below is the MACD_Color Indicator code in MQL4. I use both MT4 and MT5. So whatever indicator I develop for MT5, I also develop it for MT4. MQL5 is the language that we use in MT5 and MQL4 is the language that we use in MT4. Both are different. So when you code for MT5, you have to change the code somewhat so that it works in MT4 also. MQL5 is more elegant and modern. It is a object oriented programming language like Python, Java and C#. As said above below is the MACD_Color indicator in MQL4. I had to make changes to the above MQL5 code. For example, I had to increase the number of buffers from 2 to 5 due to the fact that MQL4 does not support a multi color histogram.
//+------------------------------------------------------------------+
//|                                                   MACD_Color.mq4 |
//|                                                     Ahmad Hassam |
//|                                      https://www.doubledoji.com/ |
//+------------------------------------------------------------------+
#property copyright "Ahmad Hassam"
#property link      "https://www.doubledoji.com/"
#property description "Moving Average Convergence/Divergence"
#property version   "1.00"
#property indicator_separate_window
#property indicator_buffers 5

//--- plot MACD HISTOGRAM
//---macdUp1
#property indicator_label1  "MACD"
#property indicator_type1   DRAW_HISTOGRAM
#property indicator_color1  clrDarkGreen
#property indicator_style1  STYLE_SOLID
#property indicator_width1  3

//--- plot MACD HISTOGRAM
//--macdUp2
#property indicator_label2  "MACD"
#property indicator_type2   DRAW_HISTOGRAM
#property indicator_color2  clrLightGreen
#property indicator_style2  STYLE_SOLID
#property indicator_width2  3

//--- plot MACD HISTOGRAM
//--macdDown1
#property indicator_label3  "MACD"
#property indicator_type3   DRAW_HISTOGRAM
#property indicator_color3  clrRed
#property indicator_style3  STYLE_SOLID
#property indicator_width3  3

//--- plot MACD HISTOGRAM
//--macdDown2
#property indicator_label4  "MACD"
#property indicator_type4   DRAW_HISTOGRAM
#property indicator_color4  clrPink
#property indicator_style4  STYLE_SOLID
#property indicator_width4  3


//--- plot MACD Signal
#property indicator_label5  "Signal"
#property indicator_type5   DRAW_LINE
#property indicator_color5  clrRed
#property indicator_style5  STYLE_SOLID
#property indicator_width5  2

//--- input parameters
input int      fastEMA=12;
input int      slowEMA=26;
input int      signalPeriod=9;
input ENUM_APPLIED_PRICE MAPrice = PRICE_CLOSE;

//--- indicator buffers
double         macdUp1[];
double         macdDown1[];
double         macdUp2[];
double         macdDown2[];
double         macd_signal[];


//--MACD values
double macd_main_1=0.0;
double macd_main_2=0.0;
//+------------------------------------------------------------------+
//| Custom indicator initialization function                         |
//+------------------------------------------------------------------+
int OnInit()
  {
//--- indicator subwindow label
IndicatorSetString(INDICATOR_SHORTNAME,
"MACD("+string(fastEMA)+", "+string(slowEMA)+","+string(signalPeriod)+")");

//--- indicator buffers mapping

   SetIndexBuffer(0, macdUp1);
   SetIndexBuffer(1,macdUp2);
   SetIndexBuffer(2, macdDown1);
   SetIndexBuffer(3,macdDown2);
   SetIndexBuffer(4,macd_signal);


//---

   return(INIT_SUCCEEDED);
  }


//+------------------------------------------------------------------+
//| Custom indicator iteration function                              |
//+------------------------------------------------------------------+
int OnCalculate ( const int rates_total,
                  const int prev_calculated,
                  const datetime & time [],
                  const double & open [],
                  const double & high [],
                  const double & low [],
                  const double & close [],
                  const long & tick_volume [],
                  const long & volume [],
                  const int & spread [])
  {


//--- set buffers as series, most recent entry at index [0]

   ArraySetAsSeries(macdUp1,true);
   ArraySetAsSeries(macdDown1,true);
   ArraySetAsSeries(macdUp2,true);
   ArraySetAsSeries(macdDown2,true);
   ArraySetAsSeries(macd_signal,true);


 int bars = rates_total - 1;
   if(prev_calculated > 0)
     {
      bars = rates_total - prev_calculated;
     }


   for(int i = bars-slowEMA-1; i >= 0; i--)

   {

   macd_main_1=iMACD(NULL,0,fastEMA,slowEMA,signalPeriod,MAPrice,0,i);
   macd_main_2=iMACD(NULL,0,fastEMA,slowEMA,signalPeriod,MAPrice,0,i+1);
   macd_signal[i]=iMACD(NULL,0,fastEMA,slowEMA,signalPeriod,MAPrice,1,i);

//--initialize the indicator buffers
   macdDown1[i]=0.0;
   macdDown2[i]=0.0;
   macdUp1[i]=0.0;
   macdUp2[i]=0.0;

//--color code the MACD bars
   if( macd_main_1 > macd_main_2 && macd_main_1 < 0)macdUp2[i]=macd_main_1;
   if( macd_main_1 > macd_main_2 && macd_main_1 > 0)macdUp1[i]=macd_main_1;
   if( macd_main_1 < macd_main_2 && macd_main_1 > 0)macdDown2[i]=macd_main_1;
   if( macd_main_1 < macd_main_2 && macd_main_1 < 0)macdDown1[i]=macd_main_1;

  }

//--- return value of prev_calculated for next call
   return(rates_total);
  }


//+------------------------------------------------------------------+
In the above MACD_Color MQL4 code we have used 5 buffers. I made a small mistake which was giving an error that the custom buffer is not supported. That I corrected by changing the OnCalculate() to its default. GBPIUSD is a highly volatile pair. Read how
Trend Trading With MACD
Now you have the MACD_Color indicator, you can use it in trend trading. MACD is not that good in telling you when to enter into a trade. So you should be very clear. MACD is not good at giving you a low risk entry. One method can be you use a moving window of past 20-30 candlesticks. If you want to go long wait for the MACD to change color to bullish and then use that window to search for a low risk entry. Once you are in, MACD is a powerful momentum indicator that can tell you the trend is going strong. You stay in the trade as long as MACD does not change color. When it changes color on H4, check H8. If the color hasn’t changed on H8, you can continue in the trade. Aim is to make 100-200 pips per trade with a low stop loss.
Trend trading requires a lot of patience. Last week I was trading EURUSD and it moved only 40 pips in 4 days. So sometimes you can find yourself in a trade that takes many days while other days you have a trade that makes 200 pips in just one day. This happens especially with GBPUSD. GBPUSD just moves very fast when it wants to move. It can suddenly change direction so you should be careful. USDCAD is also a highly volatile pair. AUDUSD like EURUSD is a slow moving pair. Don’t get me wrong. EURUSD can move fast when it wants to move. There is no way we can predict how fast the currency pair going to move.
Coming back to MACD as a trend trading indicator. The default MACD that is available on MT4 and MT5 does show any colors when the trend momentum changes. So using the standard MACD I have recoded it and now it shows color when the trend changes momentum. This is going to help you a lot when it comes to trend trading. When the MACD color changes to light green or dark green, it means the momentum has shifted to upside. When the MACD color changes to pink or red, it means the momentum has shifted to the down side. These things are not visible in standard MACD. By putting color change on standard MACD, it has become powerful.
When you see the color change from dark green to pink on MACD, it means the trend has changed from up to down. Similarly when you see MACD color change from red to light green, it means the trend has changed from down to up. Now higher timeframe has more precedence over the lowertimeframe meaning if the trend is down on H8 but H4 has changed to uptrend, it just means most probably a retracement. But things can move pretty fast. The change in trend always first appears on the lower timeframe first. Now it can be a retracement or it can be a trend change. We have no idea. You should protect your profits if you see the trend changing on the lower timeframe. This is the challenge of trend trading.
A better option is to fix a profit target like 100-200 pips. Once you have achieved it, just close the trade. When you spot a new trading opportunity, then reenter again. This will happen many times. You miss the initial start of the trend. Price is moving fast. Give up? Not at all. If you have missed the initial trend change, you can again enter on a retracement. It’s just that you will make less profit as compared to entering when the trend had changed. But this is the challenge of the game. You don’t know when the new trend starts. Anticipating the start of a new trend and entering can result into the stop loss getting hit. Do it again and once again get the stop loss hit. So it is always a good idea to first confirm that the trend has changed and capture something like 50-60% of the new trend. You simply need a winning philosophy and strategy backed up by proven positive results that you copy and execute. Just keep this in mind John Henry, owner of Red Sox made his fortune trading in a very rigid, rule defined. Henry practices a form of trading known as Systematic Trend Following. Trend trading is the name of the game my friend. Bruce Kovner became a billionaire trading trends. Trend trading is the only way to make a fortune now a days. Do you need an MBA for becoming a successful trend trader? No not at all. Read this post and discover the secrets of trend trading.
Trend trading starts with knowing when to do nothing. Trending trading requires Repeatable Alpha. Repeatable Alpha means generating profits from your trading skill. There is a saying:”There is no romance in trend trading.”Now if you want to do trend trading, you have to increase the basket of currency pairs you trade. For that matter you can increase the basket of financial instruments that you trade. This will give you a solid 5 star trade every month at least. If you just trade only one or two instruments like EURUSD or GBPUSD, you wont get a solid 5 star trade every few weeks. So increase the universe of instruments that you trade. Now on MT5, you have many more instruments that you can trade that includes cryptocurrencies, stocks and futures also. Yes, futures are available for trading on MT5 but not on MT4. These are the pairs that you should focus on EURUSD, GBPUSD, USDJPY, USDCAD, AUDUSD, NZDUSD, USDCHF, EURJPY, EURAUD,EURCAD,EURGBP,EURNZD,EURCHF,GBPJPY,GBPCHF,GBPCAD,GBPAUD,GBPNZD, CADJY, AUDJPY,NZDjPY,AUDNZD, AUDCAD,NZDCAD,CADCHF,AUDCHF,NZDCHF. This is the start. As said, you need to identify a good trend that has the potential to make 100-300 pips.
What is Reactive Technical Analysis?
Fundamental analysis is just like astrology. You cannot use it in trading practically. You just find it on financial news media like CNBC, Bloomberg and Financial Times. What we need is Reactive Technical Analysis. Yes, Reactive Technical Analysis. Let me tell you what Reactive Technical Analysis is. We don’t find trends. We just react to market moves and hopefully try to catch a big moves that can make you good money. Just focus on reacting to market moves Sometimes, you enter a trade and find the market going back towards your stop loss? What you do? Wait for price to hit the stop loss? No. You close the trade. If this happens often then you don’t have a good method to find the good moves in the market.
What is Trend Following?
All trends are historical. There is no method that can define what a current trend is. You can only identify historical trends after that have ended when you look at the charts. We are infact trend followers. We don’t know what the market is going to do next. We just wait for the market to move then we just follow it. Trend trading is reactive in nature. We do not try to predict the market. We just follow the market. Trend trading requires a lot of self discipline to follow the rules. As a trend trader, we aim for the big moves as said above. Our average loss should be much lower than our average win size. As trend traders we are market followers not predictors. You cannot predict when the market will move and start trending.
We just need a small edge. This edge can give us a huge advantage. Let me explain it with an example. Suppose we have a trading system that makes 100 pips with 10 pip stop loss. Suppose we have a winrate of only 50%. A winrate of 50% means on average we lose 50% of our trades. You might be thinking. 50% is not good and we will never make good money. But we are making more money than losing. Suppose we make 10 trades. On average we will lose 5 trades and win 5 trades. Losing 5 trades means we lose 50 pips(our stop loss is 10 pips). Winning 5 trades means we make 500 pips(on average we make 100 pips per trade). So we make 500-50=450 pips net.
Market is Always Right
As said above, we are just trend followers. We cannot guess how far the trend will go. The best estimate of tomorrow’s price is today’s price. Price is the only true objective reality in trading. Market is always right. If the market is going down and you are long, the market is right and you are wrong. If the market is going up and you are short, the market is right and you are wrong. The more you stay on the right side of the market, the more pips you make. It takes guts to face the uncertainty in the market direction.
From our childhood, we get taught that taking risk is not good. But in trading if you don’t take risk, you don’t make a good return. Taking calculated risk is different than acting rashly. Risk can be two types: 1) Blind and 2) Calculated. Blind risk is always dangerous and brings ruin. A person who takes blind risk always loses in the long run. Trend trading is all about taking calculated risk. How do you take calculated risk? By developing a trading system that has been tested thoroughly. So you know on the long run, its statistical winrate is say 50%. A Reversal Trend Trading System is always in the market. It is long. When the long position is closed, it immediately goes short. When the short position is closed, it immediately goes long. So it is always in one of the two modes: long or short. Now you can add one more phase to the reversal trend trading system: Neutral. When you close a long position, you don’t immediately go short.
Here is a conundrum. You cannot trade everything. But you cannot also not trade only one market. As said above, you need to be following enough markets so that you can ride the trend when a new trend starts on any one of the currency pair. The best three entry indicators are: 1) price, 2) price and 3) price. You cannot avoid losing. Make your losses small. Now you need home run trends to cover for your small losses. Setting a profit target at this stage is putting a stop on the potential big trend that can go 300-400 pips.
Many trader or some trader make this silly mistake. They open a position. When they find the position in a loss, they think they have a golden opportunity to add more positions at a better price. This is not smart trading. Rather it is stupid trading. You don’t add on to a position in negative. You only add when you make the first position breakeven and then open a new position so that the risk is the same as before. Always take risk management very serious. Trend trading is a waiting game. Most of the time, you sit and wait and then make money in a short time when market moves fast. The trick that most traders don’t learn is how to not lose too much in between when the market is ranging and moving sideways. Understanding and applying trend following takes time. Trend following is easy to understand conceptually. But it takes a lot of time, practice, patience and discipline to execute it correctly.
For a trend trading system to be successful, it needs to be simple and robust. It should be able to trade many instruments and all sorts of markets. MACD Trend Trading System is indeed a simple and robust system that can trade almost all instruments and most of the markets. MACD is just the difference of two moving averages and traders use moving averages a lot in their trading. MACD trend trading system can trade currencies, gold, oil, stocks, futures, cryptocurrencies. I don’t trade cryptocurrencies because they have a very big spread. I usually choose those instruments that have a small spread. You see spread is a cost that you have to pay upfront right at the time of opening of your trade. It doesn’t matter whether you win or lose, you have to pay the spread to the broker. This is how brokers run their businesses.
It will make your life much easier if you can code your trend trading rules. This way you can set your emotions aside and make your trading binary. MACD_Color is a good start. The standard MACD indicator does not tell you when the momentum weakens and changes direction. By coding color into standard MACD we can now see when the trend is getting weak and when it is getting strong. We can code more trend trading rules. Successful trend traders have proven that coding their rules works and make things a lot easier. Python is a powerful modern object oriented programming language. We can now easily integrate Python with MT5. Just install the MetaTrader module using pip command and you are all set to download as much live currency pair data as you want and analyze it using the power and fury of Anaconda and Python. Python can help you evaluate 50 currency pairs in 5 minutes. If you do it manually, you will take at least 10 minutes per pair and even then make silly mistakes by overlooking patterns that might save you from bad trades. Now keep this in mind, if you trend trading system is flawed and not good, using Python to analyze 50 currency pairs will only give you flawed results. So first make sure you have a robust trend trading system and then code it in Python.
You will be told that trend trading is a zero sum game. But it is really difficult to identify the winners and losers. Well this is not true. When the market tanks after all the loss in the market capitalization goes somewhere. It just can’t vanish in thin air. In the long run, in this zero sum game you can only profit if you have an edge that gives you a persistent advantage in winning more and losing less. So you need an edge to win. If you don’t have an edge, you will keep on losing. If you don’t have an edge, stop trading and focus on developing a trading system that provides you with an edge. As I have shown above you just need to win 50% of the trades. The trick is catching the big moves with a small stop loss. If you can do that, you can make a lot of pips.
It is the commercial hedgers who pay premium to hedge their risk in the futures market and most of the time, commercial hedgers lose mostly lose. So buying low and selling high is trading against these commercial hedgers who are transferring their risk in the market. You can also buy higher highs and sell lower lows also will help you trade against the hedgers. If you are going to win, someone else will have to lose. It can be the hedgers or others traders with bad trading strategies. In 2008, when the stock market was crashing trend followers were making money. The reason is simple. Where there is a crisis, crisis mentality develops. When the market sentiment gets negative, those who watch price action know price will fall like a stone.
But you can be wrong. No one can predict what will happen next. Take the case of Long Term Capital Management (LTCM). LTCM was run by 2 Nobel prize winners in Economics, the developers of the famous Black Scholes Options Pricing formula. Mathematically these people should have the edge over the rest of the market. According to the LTCM people market followed a perfect normal distribution. These people started placing big bets using high leverage on the assumption that they were making risk free trades. Then everything unwound itself and LTCM lost big time. Who was on the opposite side of their trades? Trend traders. Trend traders made a killing from the unwinding of LTCM. Markets are not efficient. Just forget the Efficient Market Hypothesis. Trend traders are a living proof that you can beat the market with a simple two moving average crossover strategy with some added filters of course.
Always avoid this mistake that many traders make. They let their losers run and cut short their winners in the fear that the market will reverse soon. You should cut short your losers and let your winners run. Practice this skill. In the beginning, your mind will try to wreck you and force you to do what most do, cut your winners and let your losers run in the hope that the market will turn around. Force your mind to accept loses early instead of letting them run in the false hope of market making a turn. Do we need a high IQ to succeed at trend trading? Good question. You don’t need a very high IQ score. Average intelligence is good enough for you to succeed. Of course you need determination and hard work for success.
Learning how to control emotions is very important in trend trading. Biological impulses the source of our emotions. What you need more is emotional intelligence as compared to general intelligence. Commitment to trend trading is almost just like the commitment needed to be a top class athlete. If you want to become a good football player you will have to practice daily during the week as well as on weekends. Trading is just like that. You will need commitment and determination to become a successful trend trader. Jim Simmons a great trader and a brilliant mathematician who made billions running his Medallion Hedge Fund says that thinking scientifically can help a lot in trading. Professional trend traders essentially operate scientific research labs inside their hedge funds. They have huge financial data at their disposal. They form a hypothesis and then test it using rigorous statistical tests whether it holds over many years of financial data.
Never Use Sharpe Ratio in Building Trend Trading Models
Now keep this in mind. Financial market price data is not normal. Financial returns has a skewed fat tailed distribution. In the past decade Quants burned their fingers when they foolishly assumed that they could use normal distribution to model return time series. Now everyone is very careful and doesn’t want to use the normal distribution to build their models. Many quantitative models still use Sharpe Ration which is overhyped and can give you a false sense of accuracy. Why? Sharpe Ration assumes returns follow a normal distribution. Over the last decades this has been conclusively proven that returns do not follow a normal distribution. A normal distribution is almost useless when it comes to risk management.
Always remember the small sample size can give misleading results. Let me explain with an example. There are two traders. Both have 60% winrate. Trader A has made 1000 trades and his average winrate is 60%. Trader B has made 100 trades and his average winrate is 60%. Who is better? Trader A is better. When we talk of the average we also talk about the standard deviation which tell us the dispersion of the distribution around the average. Wide standard deviation would indicate a wide fluctuation in the traders performance. So when it comes to statistics, large sample sizesgive a more accurate picture as compared to small sample size.
Buy and Hold is Dead
Buy and hold is dead. It should be clear now to most investors. Buy and hold only works in a market that is on the rise for many years and decades like it did in 1950s to 1970s. Then the market tanked. Japanese NIKKEI 225 reached 40,000 level in 1989. Now it is around 10,000. Many Japanese don’t believe in buy and hold. This is a fact millions of Japanese housewives trade forex from their homes as a way to make extra income. Dow Jones closed at 381 on September 3rd 1929. Dow Jones closed above 381 points on 23rd September 1954 almost after 25 years. So if you were buy and hold in 1929, you would have made nothing in the next 25 years. But trend trading is a fact. No one could believe that once the stock market bottomed in 2008, it will start trending up.
Update:
In the above code there were some errors. The latest bar would not paint correctly. I have corrected the code now.
//+------------------------------------------------------------------+
//|                                                   MACD_Color.mq5 |
//|                                     Copyright 2019, Ahmad Hassam |
//|                                       https://www.doubledoji.com |
//+------------------------------------------------------------------+
#property copyright "Copyright 2019, Ahmad Hassam"
#property link      "https://www.doubledoji.com"
#property version   "1.00"
#property description "Moving Average Convergence/Divergence"
#property indicator_separate_window
#property indicator_buffers 4
#property indicator_plots   2


//--- plot MACD HISTOGRAM
#property indicator_label1  "MACD"
#property indicator_type1   DRAW_COLOR_HISTOGRAM
#property indicator_color1  clrLightGreen, clrDarkGreen, clrPink, clrRed
#property indicator_style1  STYLE_SOLID
#property indicator_width1  3


//--- plot MACD Signal
#property indicator_label2  "Signal"
#property indicator_type2   DRAW_LINE
#property indicator_color2  clrRed
#property indicator_style2  STYLE_SOLID
#property indicator_width2  2

//--- input parameters
input int      fastEMA=12;
input int      slowEMA=26;
input int      signalPeriod=9;
input ENUM_APPLIED_PRICE MAPrice = PRICE_CLOSE;


//--- indicator buffers
double         macd_main[];   //MACD Histogram
double         macd_color[];  //MACD Histogram bar colors
double         macd_signal[]; //MACD Signal
double         macd_signal_color[];

//--declare MACD Handle
int macdHandle;


//+------------------------------------------------------------------+
//| Custom indicator initialization function                         |
//+------------------------------------------------------------------+
int OnInit()
  {
//--- indicator subwindow label
IndicatorSetString(INDICATOR_SHORTNAME,
"MACD("+string(fastEMA)+", "+string(slowEMA)+","+string(signalPeriod)+")");

//--- indicator buffers mapping
//--- Bind the color buffer immediately below the data buffer
   SetIndexBuffer(0,macd_main,INDICATOR_DATA);
   ArraySetAsSeries(macd_main,true);
   SetIndexBuffer(1,macd_color,INDICATOR_COLOR_INDEX);
   ArraySetAsSeries(macd_color,true);
   SetIndexBuffer(2,macd_signal,INDICATOR_DATA);
   ArraySetAsSeries(macd_signal,true);
   SetIndexBuffer(3,macd_signal_color,INDICATOR_COLOR_INDEX);
   ArraySetAsSeries(macd_signal_color,true);

//--Initialize the MACD
   macdHandle = iMACD(_Symbol,_Period,fastEMA,
   slowEMA,signalPeriod, MAPrice);


   return(INIT_SUCCEEDED);
  }


//+------------------------------------------------------------------+
//| Custom indicator iteration function                              |
//+------------------------------------------------------------------+
int OnCalculate(const int rates_total,
                const int prev_calculated,
                const datetime &time[],
                const double &open[],
                const double &high[],
                const double &low[],
                const double &close[],
                const long &tick_volume[],
                const long &volume[],
                const int &spread[])
  {


   int end;
   if(prev_calculated < rates_total)
      end=rates_total - prev_calculated - 2;
   else
      end = 1;


//--- Data preparation


   CopyBuffer(macdHandle,0,0,end+2,macd_main);
   CopyBuffer(macdHandle,1,0,end+2,macd_signal);

//---


   for(int i = 0; i < end; i++)

   {


//--color code the MACD bars

   if( macd_main[i] < 0 && macd_main[i] > macd_main[i+1])macd_color[i]=0;
   else if( macd_main[i] > 0 && macd_main[i] > macd_main[i+1])macd_color[i]=1;
   else if( macd_main[i] > 0 && macd_main[i] < macd_main[i+1])macd_color[i]=2;
   else if( macd_main[i] < 0 && macd_main[i] < macd_main[i+1])macd_color[i]=3;


  }


//--- return value of prev_calculated for next call
   return(rates_total);
  }

//+------------------------------------------------------------------+
//| Indicator deinitialization function                              |
//+------------------------------------------------------------------+
void OnDeinit(const int reason)
  {
   if(macdHandle!=INVALID_HANDLE)
      IndicatorRelease(macdHandle);
//--- clear the chart after deleting the indicator
   Comment("");
  }


//+------------------------------------------------------------------+