Naked trading is what professional traders do. Naked trading just means trading solely based on price action without using any indicators. If you are new to naked trading, you should watch this 1 hour webinar recording on naked trading.
Candlesticks On Weekly and Daily Timeframes Are Important Signals
In the last year, my trading strategy has evolved. I now look for very low risk trades using candlestick analysis.The aim is to make 100-200 pips with a small stop loss of 10 pips. I have stopped using market orders. I only use pending orders now. Using pending orders you can reduce your risk to a low level. The aim is to make 200 pips with 10 pips stop loss. Every week you can get 2-3 trades like these on different currency pairs.
Candlesticks are powerful signals especially those on weekly, daily and H4. A weekly candle encompasses a whole week of price action. The high, low and close of the weekly candle are important levels that you should watch carefully. In the same manner daily candle encompasses whole 24 hours of price action. I start my daily trading by looking at the daily candle. The high and low of the daily candle are very important levels that you should mark on the chart. So let’s start with a few example so that you understand how simple day trading can be.
GBPUSD 200 Pip Trade Example
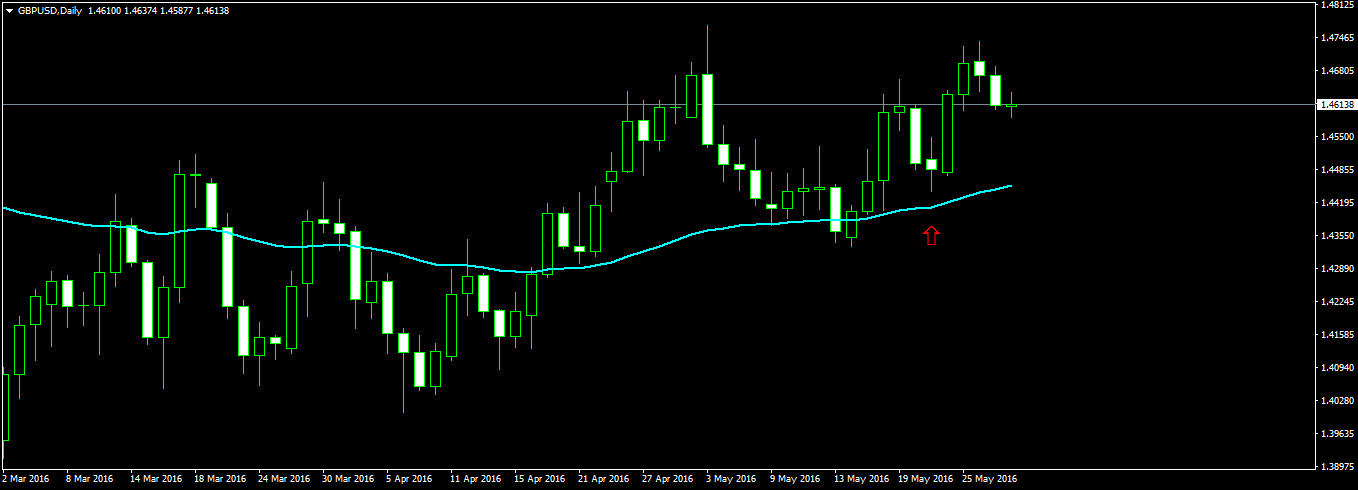
Take a look at the following GBPUSD daily chart.

In the above chart you can see a red arrow. We are going to trade the two bullish daily candles that you are seeing in the above screenshot. Aqua line is the EMA 50. Price is above EMA 50 so the market is bullish. You can see in the above screenshot, we don’t have any indicators. We will trade solely based on price action and candlestick analysis. Take a look at the following screenshot!

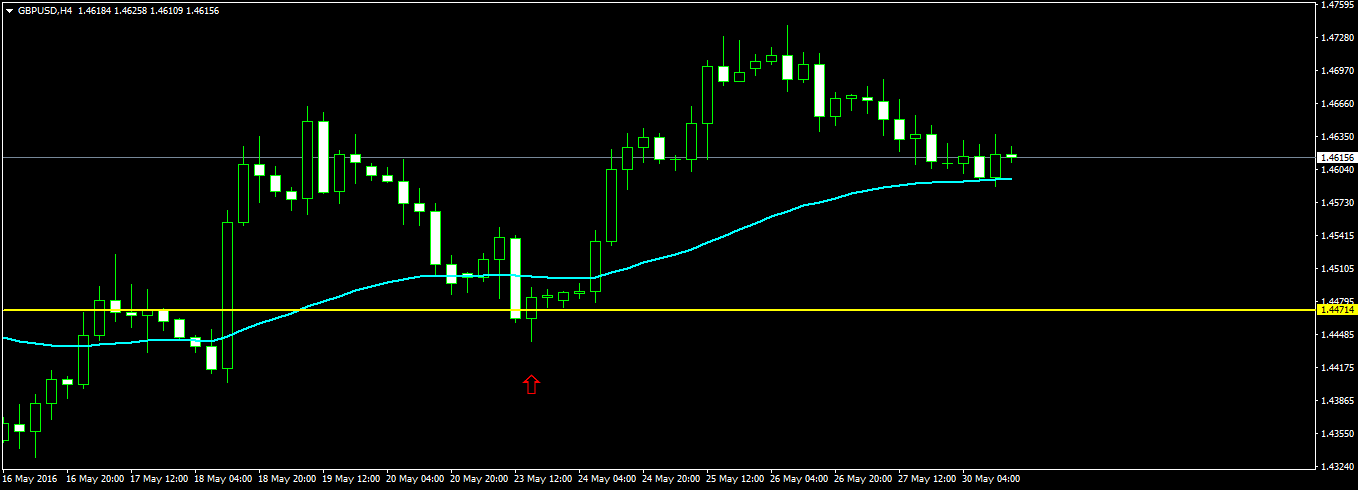
This is now the screenshot of GBPUSD H4 timeframe. You can see in the above screenshot that the day closed with a big bullish H4 candle which is a signal that the next day will be bullish. You can also see a yellow line in the above screenshot. This yellow line is the low of the next three H4 candles that are formed after the the H4 candle just above the red arrow. The next H4 candle made a low of 1.44740 and the next H4 candle after this candle makes a low at 1.44743 which is a strong signal that market is going to respect this level for today.
We place a pending buy limit order just 10 pips above this level at 1.44810 with the stop loss is 1.44710. Our day is now done. We don’t need to watch the charts. We will again check the charts after 4 hours. Either the pending order will get filled or it will not get filled. The pending order can get filled and the stop loss can also get hit. But we are confident that market is not going to go below the 1.44740 level. Our stop loss is at 1.44710 just 3 pips below it. Our total risk is 10 pips. Looking at the charts, we know price is bouncing up from EMA50 so a 200 pip move is easily possible. We place the take profit at 200 pips. Next day we will decide whether we should close the trade early or let it continue and hit the 200 pips profit target level.
After 4 hours when we check, the pending order has been filled and the trade is going positive. So we close the computer for the day. There is no point in watching the charts now. It will take price time to reach the target. Next day we check again and we find the the trade in a profit of 120 pips and the daily candle formed was strongly bullish. So it means price will continue to rise. There is a strong possibility of the take profit target to get hit. We don’t close the trade and let it continue. The take profit target is hit and we make 200 pips with a small risk of 10 pips which gives us an excellent reward to risk of 20:1.
USDJPY 200 Pips Trade Example
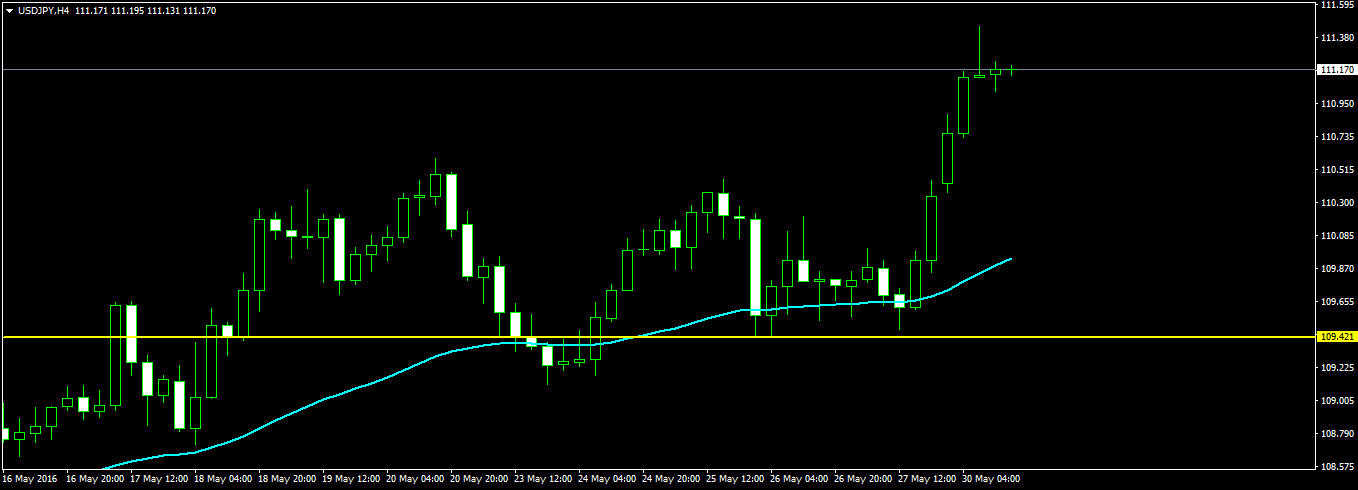
Take a look at this USDJPY H4 chart.

In the above screenshot you can see the yellow horizontal line. I haven’t shown the daily chart. But this yellow line is the low made by the daily candle. This is the level 109.418. Always keep this in mind when the price makes a high or low, it tries to retest it. This whole strategy is based on this principle. We place a pending buy limit order at 109.490 and the stop loss at 109.390. So our risk is 10 pips. As said before, the pending order may get filled or it may not get filled. If it doesn’t get filled we will look for another opportunity. We place the pending order and go away and check after 10 hours. The order has been filled and right now the trade is in a profit of 150 pips. I haven’t closed the trade. Why? You can see the last candle which is bullish so I am confident that the 200 pip take profit target will be hit. Let’s take one more example.
GBPJPY 200 Pip Trade Example
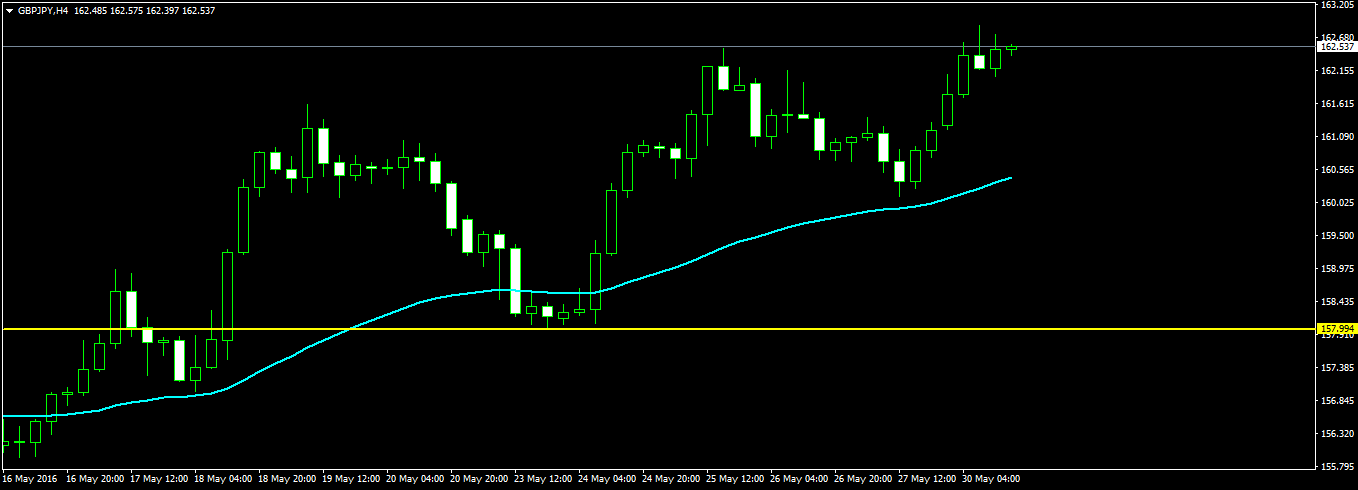
Below is a screenshot of GBPJPY H4 chart.

Now this is another example of this simple candlestick trading strategy. You can see the usual yellow line in the above screenshot. 158.067 is the low that has been made by the daily candle. We place a pending buy limit order with entry at 158.157 and the stop loss is at 158.000. Risk is now 15 pips. The spread on GBPJPY pair is mostly 5 pips so we have to cater for this spread. Take profit target is 160.157. The take profit target was easily hit.
As you can see this is a simple candlestick trading strategy. Basically this strategy entail using the high and low of the weekly and daily candles to place pending orders. Most of the time you will see the 200 pip profit target will be hit. You can use the weekly candle for this strategy. You can use the high/low of the daily candle for this strategy. As you can see most of the time you will see price action respecting the daily candle high/low.
KISS Trading Is The Best Trading
Suppose you make 1o such trades per month. Suppose your winrate is only 50%. This means in 10 trades, you win 5 and you lose 5. Losing 5 trades means you lose only 50 pips and making 5 winning trades means you make 1000 pips. So net you make 950 pips. The good think with this candlestick trading strategy is that you don’t need to watch the charts continuously. This means you will have ample of time to enjoy time with your family and friends. Just watch the weekly candles on the different pairs during the weekend and plan your trades. As said above you can also use the daily candles in your trading strategy. Just place the pending order and that’s it. I am a firm believer in the KISS Trading. KISS means keep it super simple.
If you want more trades you can reduce the take profit target to 100 pips. This will give you a reward to risk of 10:1. So even with a take profit target of 100 pips you can make 500-1000 pips per month with a small loss of 40-50 pips. The crux of this strategy lies in planning. Since you are trading on H4, you don’t need to stay glued to the charts. As you can see this is not a titanium coated trading strategy. You are not using any sophisticated indicators that give you the buy/sell signals. You are only using simple price action principles. High and low made by the weekly and the daily candles are important support and resistance levels on intraday level.
Did you read my last post on the M30 Day Trading Strategy? If you haven’t you can read that post as well in which I show you can double your account in one day while keeping the risk low. Risk is the most important thing in a trade. If you can manage the risk, you will see your account grow exponentially. M30 Day Trading Strategy requires you to sit in front of the computer and watch each M30 candle. It is upto you which style of trading you adopt. The first style entails opening the charts and placing a pending order and that’s it. You are done in 10 minutes daily. The other style requires you to watch the charts continuously. I would prefer the first style of trading in which you don’t have to watch the charts continuously.